
Transfer Pricing Documentation
There is no doubt that all tax departments would like to have some form of dashboarding, but might not know where or how to start.
Most Enterprise Performance Management (EPM) solutions have basic dashboard capability. Alternatively, most corporates have licenses for sophisticated data visualization tools like Power BI, Qlik and Tableau already in use in other departments within their organization.


It might be a matter of optimizing what you already have or, if budget allows, choosing your own software solution.
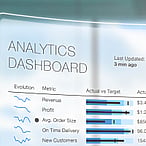
Dashboards are useful as project management tools to track different tax reporting progress and filings across geographies within the group. Even more importantly, tax KPIs keep objectives at the forefront of decision making. It’s also essential that Tax departments communicate their objectives to internal stakeholders.
Benefits of having tax dashboards
- Increased cohesion on how goals relate to one another
- Instant snapshot of which areas are on target and how this impacts the company’s overall performance.
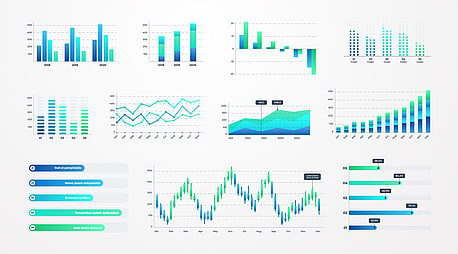
- Using visual components like charts, diagrams, and maps, data visualization tools provide an approachable way to recognize and explore trends, patterns, and outliers in data
- Identify where problem areas are forming, as well as giving insights that help you hone your targets
- Experiment with adjusting targets and policies, in order to be more effective overall.
We follow a simple approach when working with you on dashboarding
Think about what you want to measure, which entities, geographies and for which users
Set KPIs with objectives or comments of what you want to measure
Collect the required data with clear audit trails
Choose graphic designs that suit you (but remember, chart choice can make or break the comprehension. Remember: Cleanliness makes it easier to see!)
Finally, seek to continue evolving your dashboard